Contact center KPIs are the metrics that show whether the operation is healthy and whether agents are getting better. The ones that matter sit in four groups: quality, efficiency, proficiency, and retention. Volume metrics still matter, but the industry is pivoting toward indicators that reflect the quality of the customer journey and contact center CX improvement.
Most contact center scorecards still measure what mattered in 2003, when customer interactions, customer service, and the technology behind them worked very differently. Today, four numbers actually predict whether customers come back and agents stay: first contact resolution, CSAT, quality monitoring scores that track to CSAT, and attrition. Average handle time is not one of them.
A high-performing operation balances efficiency, quality, and growth. Here are the 14 metrics, with what each one means and what good actually looks like.
| KPI Category |
Metric |
Definition |
What Good Looks Like |
| Quality |
CSAT |
Customer Satisfaction Score |
Scores holding steady across teams, not just on average (ICMI) |
| Quality |
NPS |
Net Promoter Score |
More promoters than detractors, and the gap widening |
| Quality |
Sentiment |
Tone and emotion of the customer during the interaction |
Positive sentiment rising, negative concentrated in known issues |
| Quality |
QM Score |
Quality Monitoring evaluation |
Scores that predict CSAT, not just adherence to a form |
| Efficiency |
FCR |
First Contact Resolution |
The customer does not come back about the same issue |
| Efficiency |
AHT |
Average Handle Time |
Stable, and never the number an agent is chasing |
| Efficiency |
Occupancy |
Time spent on active tasks |
High enough to be productive, low enough that agents are not burning out |
| Efficiency |
Shrinkage |
Time agents are not available |
Planned time accounted for, unplanned time explained |
| Efficiency |
ASA |
Average Speed of Answer |
Service level met on ordinary days, not just quiet ones |
| Proficiency |
Ramp Time |
Time to reach full productivity |
New hires reaching full productivity faster than the last cohort |
| Proficiency |
Knowledge |
Learning completion |
Completion followed by a visible change in the metric the training targeted |
| Proficiency |
Coaching |
Frequency of feedback sessions |
Every agent coached on something specific, not everyone coached equally |
| Retention |
Attrition |
Rate of employee turnover |
Falling year over year, with the first 90 days no worse than the rest |
| Retention |
ENPS |
Employee Net Promoter Score |
Agents recommending the job to people they like |
Quality metrics
CSAT is the post-interaction score, and the number to watch is not the average. An operation at 84% across the floor can be hiding one team at 62%. Scores holding steady across teams is the signal; the mean is what hides it.
NPS asks whether a customer would recommend your company, service, or product. It moves slowly and it moves for reasons well outside the contact center, so read it as a trend and never as a coaching target.
Sentiment is the tone and emotion of the customer during the interaction, now measurable at scale across voice and chat. Rising positive sentiment is good news. Negative sentiment concentrated in known issues is better news than negative sentiment spread evenly, because concentration is something you can fix.
Quality monitoring scores are where most scorecards quietly break. A QM form measures adherence to the form. The real question is whether the score predicts CSAT, and if your best-scoring agents are not your best-rated agents, the form is measuring the wrong things. That correlation is the whole job. As Ian Chappell, Director of Consulting, International at Centrical, puts it: “We need to correlate: if you push metric A, what does that do downstream?”
Efficiency metrics
First contact resolution is the efficiency metric that behaves like a quality metric, which is why it gets its own section below.
Average handle time is the most-tracked and least-useful number in the industry. It is worth watching as a capacity input. It is not worth leading with, and it should never be the number an agent is chasing. “Handle time is no longer the biggest deal,” says Melissa Chang Esposito, Senior Director of Customer Success at Centrical. “Some clients have removed AHT from the agent scorecards.”
Occupancy is the share of an agent’s available time spent on live work. Too low and you are paying for idle capacity. Too high and you are paying for it later, in attrition. There is no universal right number, only a range your operation can sustain.
Shrinkage is everything that takes an agent off the phone: training, breaks, coaching, absence. The mistake is treating all of it as waste. Coaching time is shrinkage. So is the training that shortens ramp. Planned shrinkage should be accounted for and protected. Unplanned shrinkage should be explained.
Average speed of answer tells you whether you are staffed correctly, and it is only meaningful on ordinary days. Service level met on a quiet Tuesday is not service level.
Proficiency metrics
This group is the one most operations do not track at all, and it is the one that predicts next quarter’s performance.
Ramp time is how long a new hire takes to reach full productivity. The number matters less than the direction: each cohort should get there faster than the last. Flat across four cohorts means onboarding is not learning anything.
Knowledge, measured as learning completion, is half a metric on its own. Completion tells you someone clicked through. What you want is completion followed by a visible change in the metric the training targeted. Without that link, learning completion is an activity number.
Coaching frequency has the same trap. Every agent coached this month is a compliance statistic. Every agent coached on something specific to them is a performance one. Chappell says: “The best operations are characterized by the habits their managers have built.”
Retention metrics
Attrition is the metric that prices every other one. It should be falling year over year, and the first 90 days should be no worse than the rest of the tenure curve. When early attrition runs hotter than late attrition, the problem is hiring, onboarding, or the gap between how the job was described and what it is. It also feeds straight back into ramp time: every early exit resets a cohort that had not finished paying for itself.
Employee NPS asks agents whether they would recommend the job. It is a soft number that moves before attrition does, which makes it the most useful early warning on this list.
How to pick the KPIs your operation actually needs
See these 14 metrics as a menu to pick from. An operation cannot easily manage all of them at the same time, and which ones you pick depends on what the operation is for.
Start from the business goal, not the metric list. An inbound service desk resolving problems and an outbound sales team working a pipeline will read the same handle time number in opposite directions: short is a good sign in one and a warning in the other. A BPO carrying contractual service levels has to track them whether or not they predict anything. An internal center usually does not.
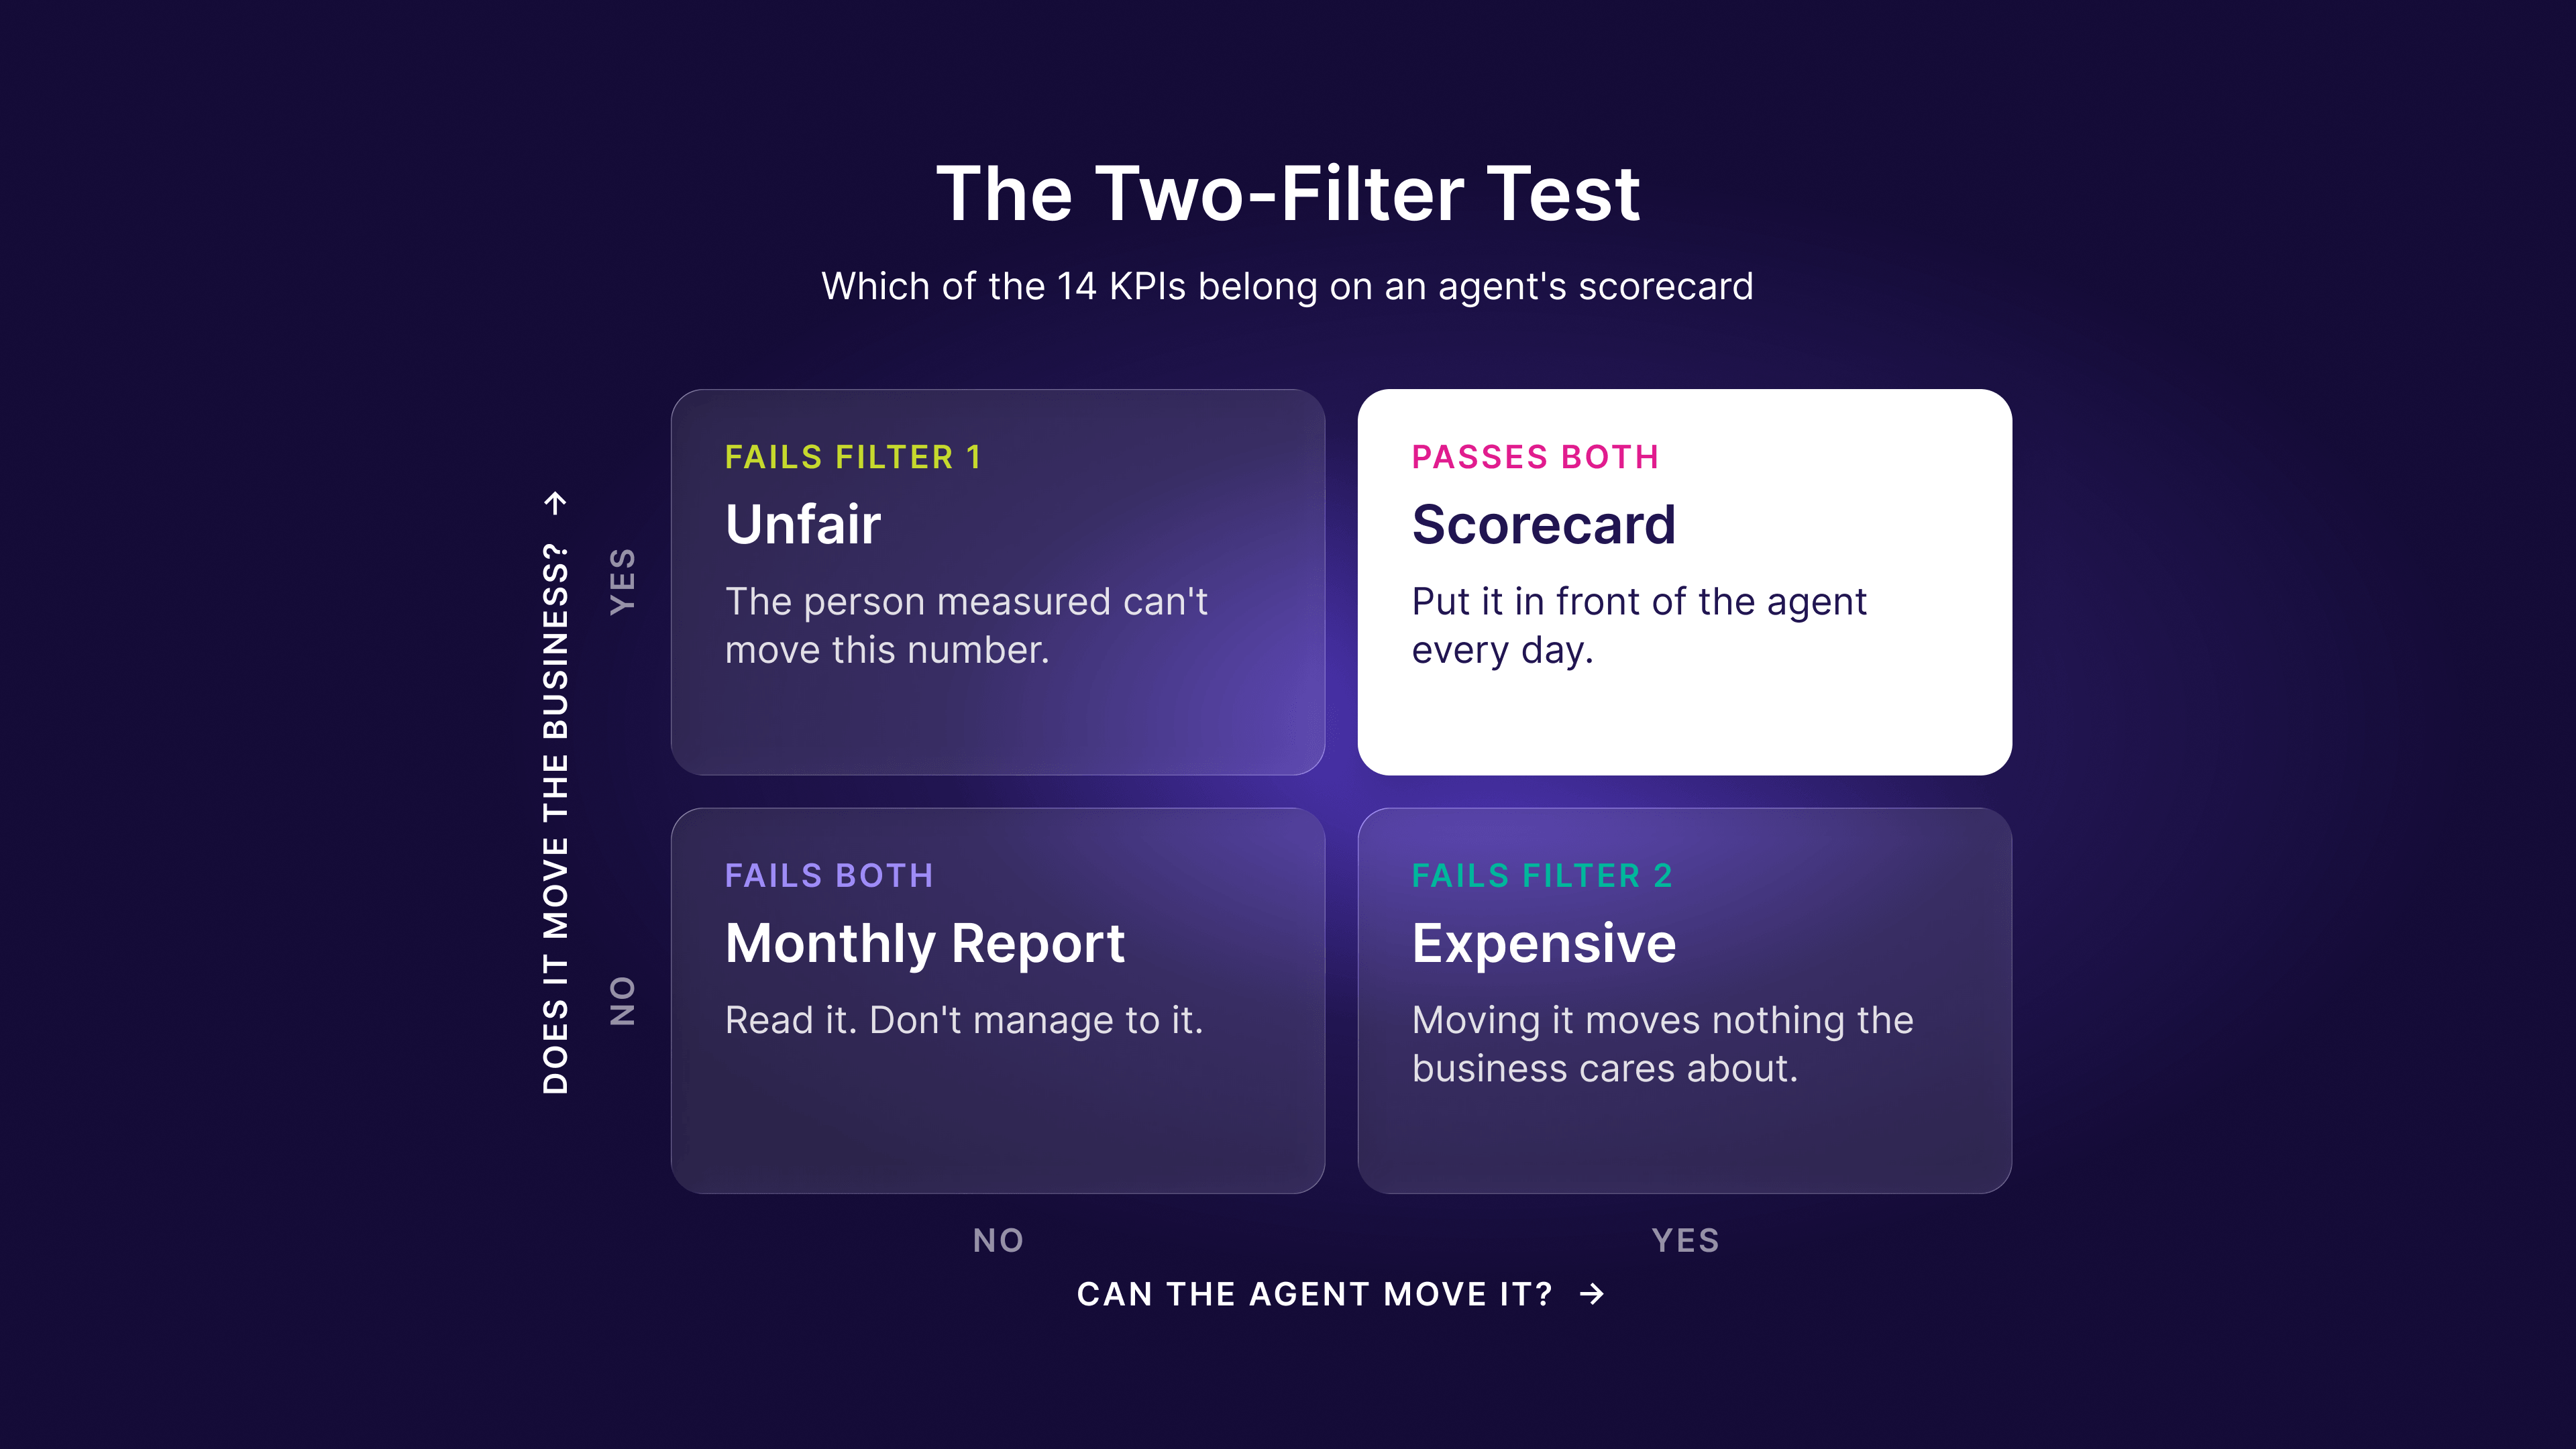
Then apply two filters:
- Can the person being measured actually move this number?
- Does moving it move something the business cares about?
A metric that fails the first test is unfair. A metric that fails the second is expensive. Anything that survives both belongs on the scorecard. The rest belongs on a report someone reads monthly.
First contact resolution is the primary driver of customer loyalty, and it is also a direct measure of agent proficiency. That double reading is what separates it from everything else on the list.
FCR drives customer loyalty because it shows respect for the customer’s time. When an issue is resolved immediately, customer effort score drops, and effort is a stronger predictor of repeat business than almost any efficiency metric. It also reframes the speed question.
“Customers are probably willing to wait a little bit longer if it’s done right first-time,” Chappell says.
The proficiency half is just as direct. Agents who resolve complex issues on the first try are demonstrating product knowledge and problem-solving, not speed. Prioritize modern resolution metrics over outdated volume-based targets and your agents start solving problems instead of clearing queues.
The reason so few operations lead with FCR is habit. “We obsess over metrics we have measured for years because we know how to do it,” Chappell says.
Building a balanced scorecard for the frontline
A supervisor can watch handle time spike while customer satisfaction climbs. Both numbers are right. The scorecard is the problem.
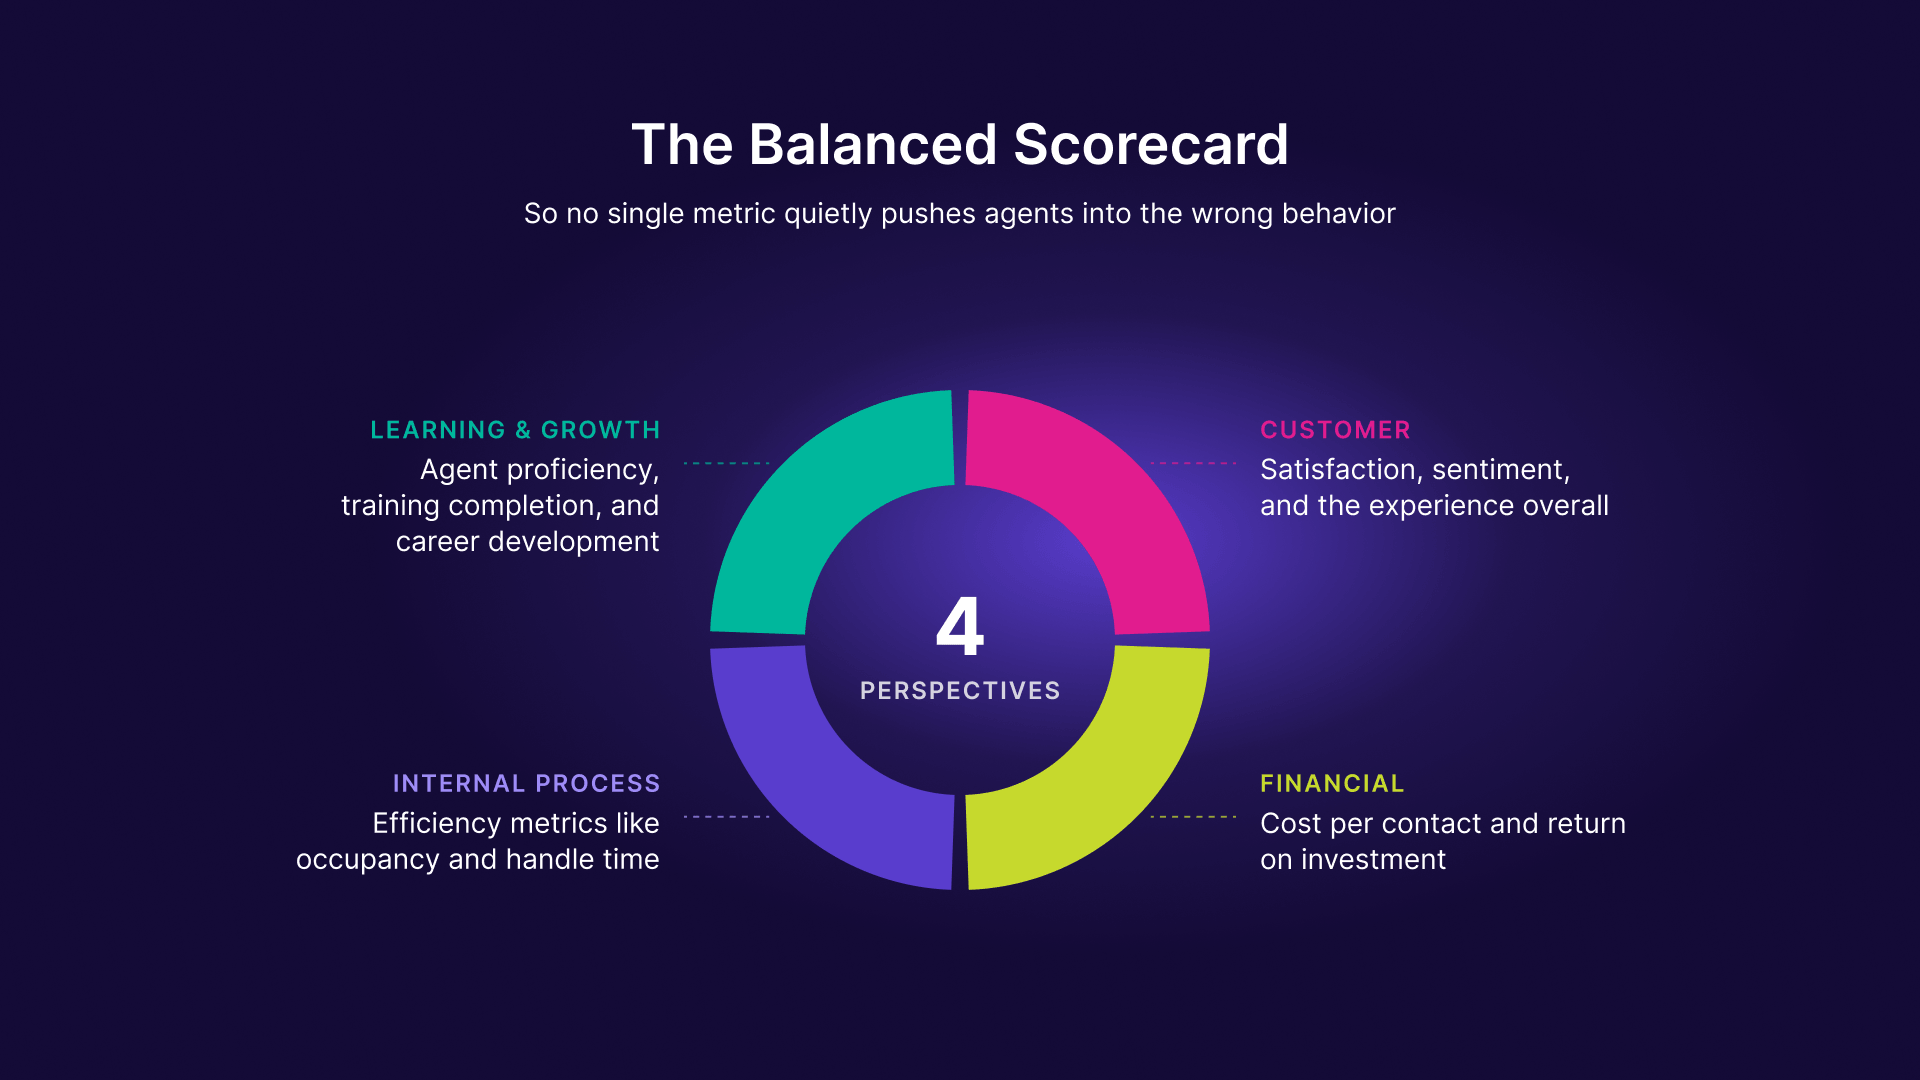
A scorecard has to balance four perspectives, because otherwise one metric quietly pushes agents into behavior nobody asked for. Implementing a balanced scorecard for BPOs and internal centers alike prevents the narrow focus on speed that often leads to poor quality and high attrition.
- Customer: satisfaction, sentiment, and the experience overall.
- Financial: cost per contact and return on investment.
- Internal process: efficiency metrics like occupancy and handle time.
- Learning and growth: agent proficiency, training completion, and career development.
The test of a balanced scorecard is whether a manager can hold two good numbers and one bad one without panicking. Chappell puts it as a question: “If I’m a manager and my quality’s great, and my CSAT scores are great, my first contact resolution’s great, why would I be obsessing about keeping my average handle time down?”
One more thing about the four perspectives: they are not permanent. The mix that fits your operation today will not fit it in a year, because the work, the channels, and the tools keep moving. “Businesses need to get better at continually rethinking what they want to measure,” Chappell says.
Connecting organizational strategy to daily dashboards
KPIs only drive behavior when high-level goals are visibly connected to daily agent dashboards. Call it the ladder from strategy to the frontline.
If leadership’s priority is reducing churn, an agent should not be rewarded solely for a low average handle time. Their dashboard should highlight contact center quality assurance scores and first contact resolution, because those are the behaviors that actually reduce churn.
The data is rarely the missing piece. “Every contact center we speak to is data rich,” Chappell says. “They’re drowning in data, but it’s the insight and the action that are lacking.” His shorter version: “Nobody is joining the dots.” And the place the dots come apart is specific. “The biggest gap is between seeing something that’s happening and doing something about it.”
Closing that gap takes a system that translates corporate OKRs into actionable performance goals: the specific number an agent sees, and the specific coaching action a supervisor takes. Objectives and the KPIs underneath them are not two separate conversations. You cannot have one without the other, and the contact center is where most organizations let them come apart. Bringing an organizational goal down into frontline performance measurement is also what creates accountability that otherwise does not exist. Most operations do not lack data. They lack a next step attached to it.
Agents engage when they can see how their own numbers ladder up to the goal the company set.
Book a demo to see how the Orchestration System turns a business goal into a running performance program for your frontline.
How do I realign my current metrics with agent engagement goals?
Start with the audit, not the scorecard. Find every KPI that pays an agent for speed and ask what it costs you downstream. Then reweight: quality monitoring and CSAT above volume, and agent behavior metrics that reward learning next to the ones that reward throughput. Tracking agent proficiency keeps the focus on skill development rather than call count.
Three steps, in order:
- Audit your current KPIs to identify metrics that trigger negative agent behaviors, such as rushing customers to meet handle time targets.
- Rebalance your scorecard to include a significant portion of quality and growth-based metrics.
- Implement real-time visibility so agents can track their progress against these new goals throughout their shift.
First contact resolution. It is the one metric here that reads as both a customer outcome and an agent capability: when someone resolves a complex issue on the first try, the customer stops repeating themselves and the operation stops paying for a second contact. Efficiency metrics tell you what a call cost. FCR tells you whether it worked.
A scorecard that measures four perspectives at once: the customer, the financials, the internal process, and learning and growth. The point is not completeness. It is that no single metric can quietly dominate the others and push agents into behavior that wins on one number and loses everywhere else.
Why do efficiency metrics like average handle time backfire?
Because agents are rational. Measure them on how long a call takes and they will end calls faster, including the ones that needed more time. Handle time is worth watching. It is not worth leading with, and it should never be the first number an agent sees on their dashboard.






 Engage and motivate your frontline teams
 Deliver world class CX with dynamic, actionable quality evaluations
 Boost performance with personalized, actionable goals
 Nurture employee success with the power of AI
 Listen and respond to your frontline, continuously
 Drive productivity with performance-driven learning that sticks
 Drive agent efficiency, deliver client results
 Keep tech teams motivated and proficient on products and services while exceeding targets
 Maintain compliance while building customer happiness and loyalty
 Enlighten energy teams to boost engagement
 Engage, develop, and retain your agents while driving better CX
 Improve the employee experience for your reservations and service desk agents

 Gal Rimon
 Madeleine Freind

 Natalie Roth
 Linat Mart













 Doron Neumann
 Daphne Saragosti
 Ella Davidson
 Ariel Herman
 Ronen Botzer